
ScanEZ Cloud Portal Dashboard.
The dashboard is the main screen you’ll be taken into upon login.
The dashboard shows a variety of basic information regarding your ScanEZ Station(s)
Note you will only see data from machines your account is assigned to.
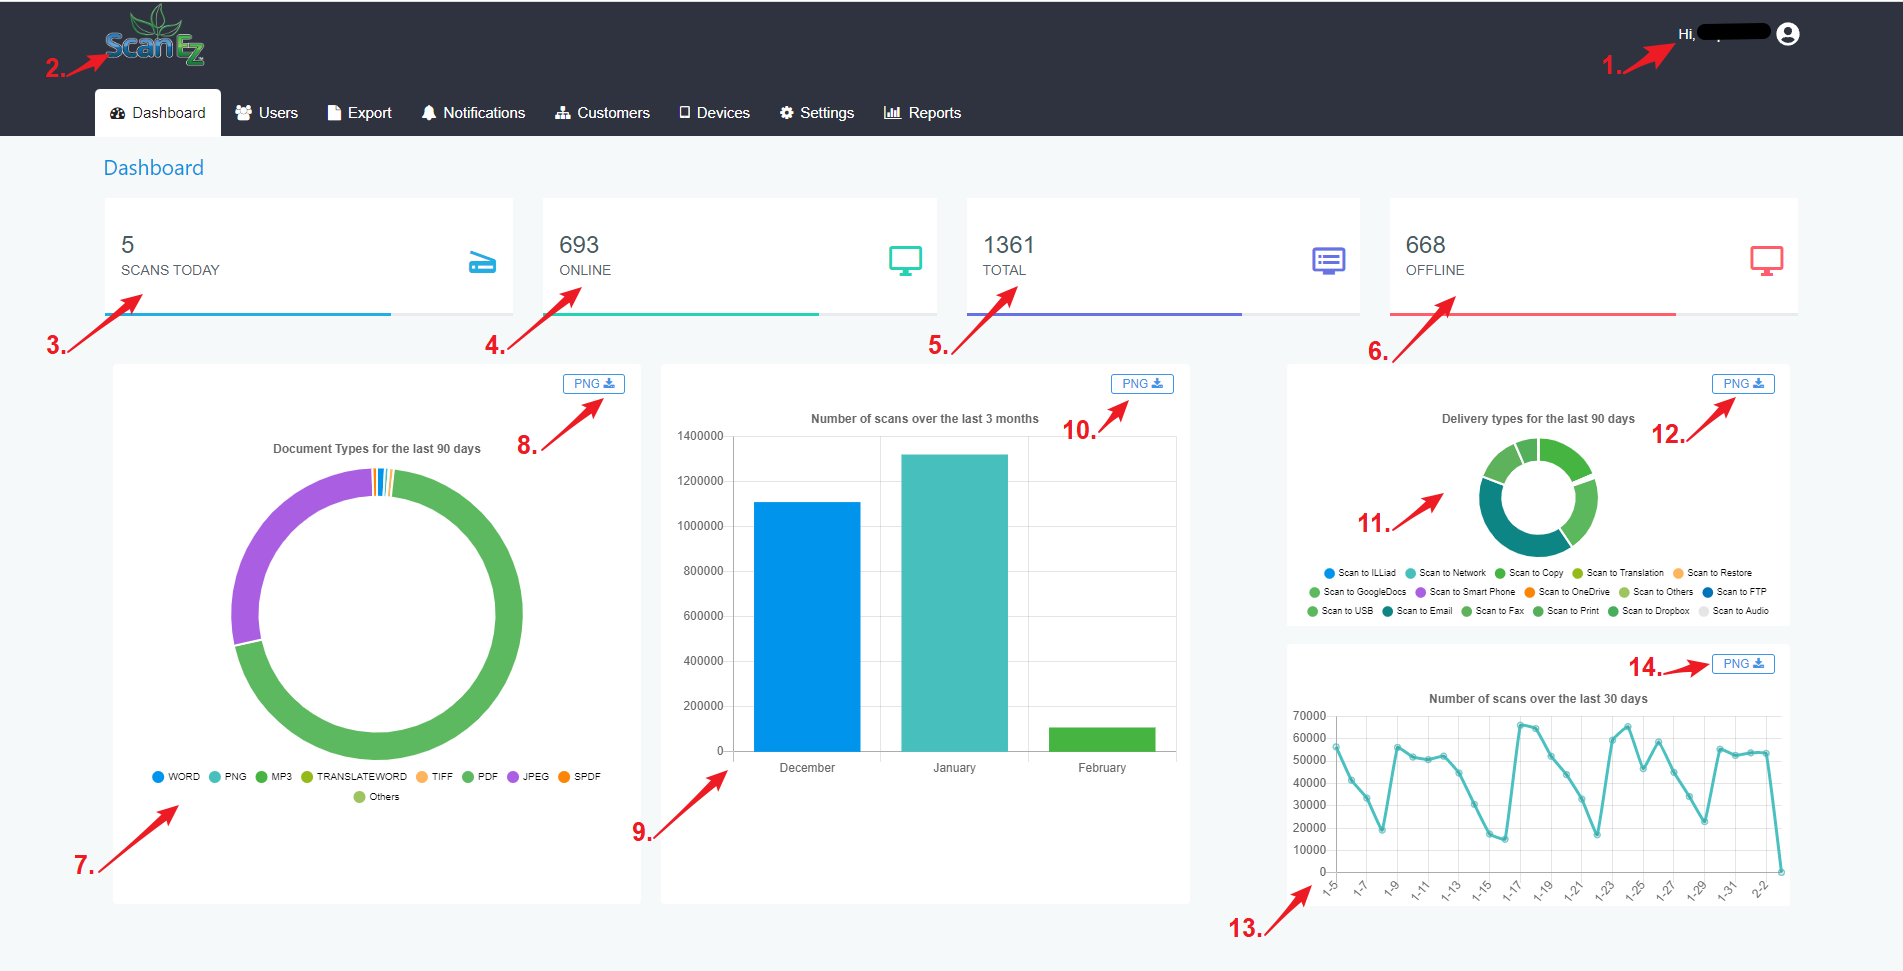
In the below points, all the functionality of the dashboard is explained:-
At the top right, we can see the username whose account is logged in. We can also log out from here by clicking on the profile photo we get an option for sign-out. Also, we can change the password from here.
Official logo of our ScanEZ.
Shows the number of scans done that day.
Shows the number of machines currently online.
Shows the total number of machines in your account.
Shows the number of machines currently offline.
The Donut chart represents scanned document types for the last 90 days.
We can export the Donut chart report as .PNG image by clicking the PNG button.
The Bar chart represents the number of scans over the last 3 months.
We can export the Bar chart report as .PNG image by clicking the PNG button.
The Donut chart represents delivery types for the last 90 days.
We can export the Donut chart report as .PNG image by clicking the PNG button.
The Line graph represents the number of scans over the last 30 days.
We can export the Line graph report as .PNG image by clicking the PNG button.